
NUMB3RS was a TV show that aired from 2005 -2010 that focused on how mathematics is always important in daily life, often in unexpected ways. The program showcased using math in astonishing ways to solve crimes.
Many people are surprised how much simple math is involved in day-to-day wildlife rehab and medicine. Lots of different data is collected, tracked and analyzed. However, it encompasses much more than just fluid calculations and drug doses.
Data is important to many aspects of any organization. It helps show what they’re doing right, what areas need improvement, helps secure funding and a host of other things.
Here at Wild Instincts we track lots of different data: survival rates, admissions, food intake, disease outbreaks are just a few.
At the end of every calendar year we compile and analyze what we collected and compare to other years. Here we’ll try to provide a snippet in a way that doesn’t make people glaze over when they hear MATH or NUMBERS.
For instance, in 2021 we treated 1306 patients from 118 different species from 39 different counties.
We admitted the same number of wild animals as the human population of Glenwood City, WI, the site of the yearly St. Croix County fair.
There are 72 counties in WI so last year we admitted patients from over half of all the counties in WI. Many years it’s even higher than that, but it’s always a big geographic area we cover! We also transferred in patients from Michigan and Minnesota, so we had admissions from three different states.
Keep in mind also, we do this with only three permanent staff, a few seasonal interns and a handful of volunteers.
Some interesting items from compiling and comparing year to year:
Even though they started Wild Instincts 11 years ago, Mark & Sharon have been wildlife rehabbers for a very long time. In 1998 they started tracking how many patients they’ve been personally responsible on their permits. As of 12/31/2021 that total was 19,865.
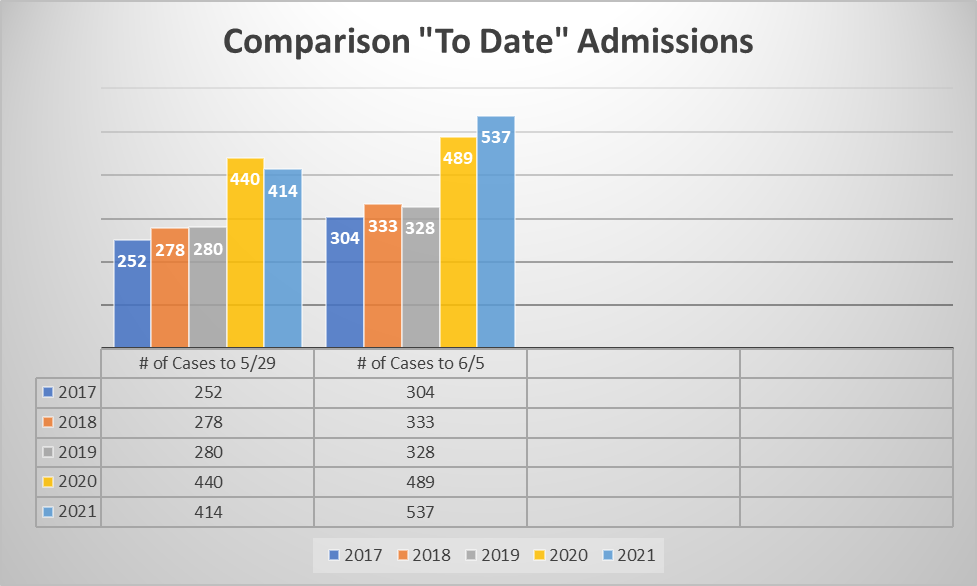
Sometimes numbers and data analysis clarify something we may suspect or experience. A perfect illustration of that is our “To Date” category.
Way back in 1998 Mark & Sharon started tracking how many patients they saw to May 29th and then to June 5th. This was designed to compare what the affect of the Memorial Day Weekend kick-off to tourist season in the Northwoods had on admissions. Many people would come North to their cabins and open them up for the summer and find unexpected house guests or injured wild friends.
The last two years during COVID, we have continued to operate as usual. We kept our same hours and services. We kept the same three staff. We reduced volunteers to less than six. Intern levels fluctuated but were never at full capacity.
Other facilities were forced to reduce hours and limit their admissions so we assumed some of our frantic Springs were due to more admissions that would normally go to other facilities and not having a full staff of interns at any time.
Looking at our comparative data for that time, however, reveals to what degree this occurred and validates our exhaustion:
Will this trend continue? Is it strictly due to COVID? Is a component of this due to climate change? As more people relocate to their Northwoods cabins permanently, will this be trend be permanent?
Stay tuned as we continue to collect and analyze date and more importantly, adjust so we may continue to provide top quality care to as many of our wild friends as possible.

Leave a comment